(January 10, 2013) Monthly home prices in the United States continued to improve for the tenth time in the last twelve months, increasing by 0.5 percent from September to October according to the Federal Housing Finance Agency’s (FHFA) monthly House Price Index (HPI).
October’s home prices were 5.6 percent higher than they were a year ago but are still 15.7 percent below their peak in April 2007. Home prices are at roughly the same levels last seen in July of 2004.
FHFA gathers its data by calculating purchase prices of houses backed by mortgages sold to or guaranteed by Fannie Mae and Freddie Mac. The data is then broken down into nine geographic Census Divisions.
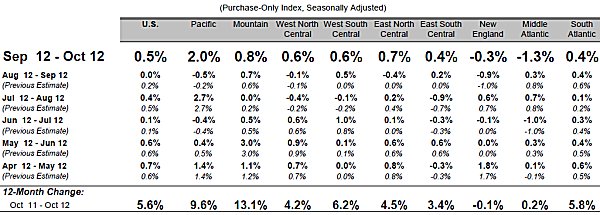
Seven of the nine Census Divisions posted monthly price gains in October with the Pacific Division reporting the most improvement, increasing 2.0 percent, followed by the Mountain Division with a 0.8 percent gain while the East North Central Division posted a 0.7 percent improvement.
The Middle Atlantic and the New England Divisions posted the only declines of 1.3 and 0.3 percent respectively.
Eight of the nine Divisions registered year-over-year price gains with the Mountain Division posting the largest yearly increase of 13.1 percent followed by the Pacific Division with an 9.6 percent annual gain. The New England Division reported the only decline in annual prices of 0.1 percent.
Census Divisions:
Pacific: Hawaii, Alaska, Washington, Oregon, California
Mountain: Montana, Idaho, Wyoming, Nevada, Utah, Colorado, Arizona, New Mexico
West North Central: North Dakota, South Dakota, Minnesota, Nebraska, Iowa, Kansas, Missouri
West South Central: Oklahoma, Arkansas, Texas, Louisiana
East North Central: Michigan, Wisconsin, Illinois, Indiana, Ohio
East South Central: Kentucky, Tennessee, Mississippi, Alabama
New England: Maine, New Hampshire, Vermont, Massachusetts, Rhode Island, Connecticut
Middle Atlantic: New York, New Jersey, Pennsylvania
South Atlantic: Delaware, Maryland, District of Columbia, Virginia, West Virginia, North Carolina, South Carolina, Georgia, Florida
Tags: FHFA, home prices, HPI, census divisions, price gains, price declines
Source:
FHFA
Reported by Shirley Allen


